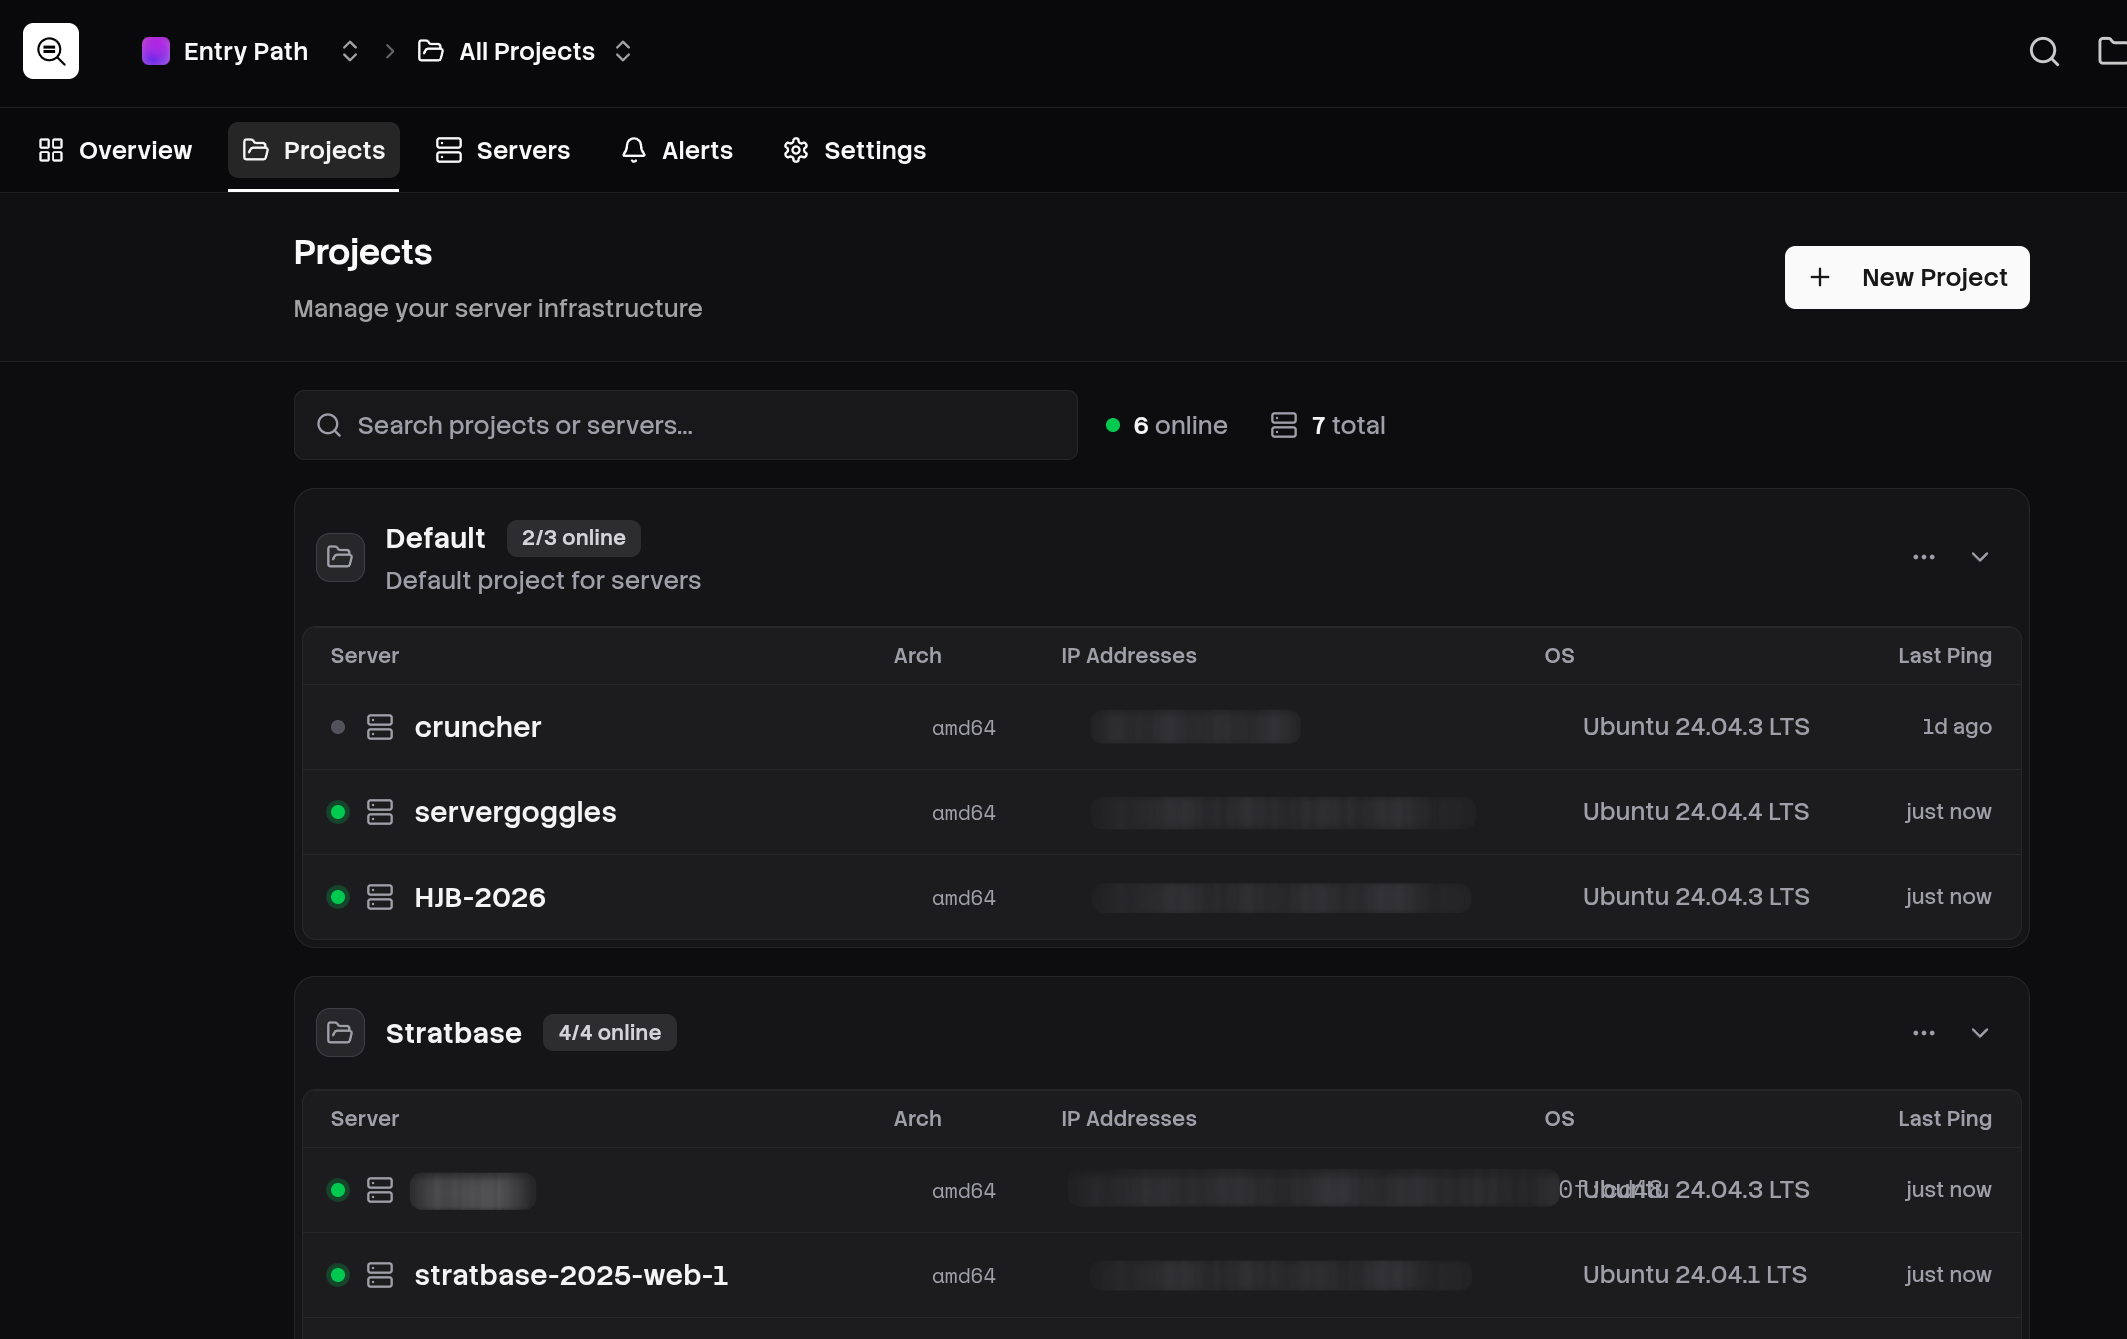
ServerGoggles
Server monitoring without the headache.
Observability is a key part of any engineering team. You need to know what's going on. Are your servers up? Are they overloaded? Are we actually underprovisioned for our use case?
All of these questions can save you time, money and headache.
I went looking for some monitoring tools and the ones I found were either incredibly expensive, difficult to use or just had far too much going on. I found one with a pricing page that had over 20 sub-pages! I just want to see what my server's CPU usage is and get told if it dies!
Get your goggles on
I have experience making this kind of product. At a previous company I built an internal server monitoring tool called Portal, which gave us a big dashboard of the essentials. CPU usage, RAM usage, storage usage. It would fire off slack notifications if any stayed above a configured threshold for more than a few minutes. It worked for us, but it was incredibly basic and between working on other projects I didn't have the time to make it as nice as I'd like. There wasn't a business need, I get it.
ServerGoggles takes what I learned from that experience and folds in some of my newer requirements. Some of my servers launch services via Docker, for example, so I've integrated that.
When I created this before, all of the logs were stored in regular old Postgres. This worked fine for a limited amount of servers but the history had to be regularly pruned or the tiny VPS it was running on would fill up. This was a tradeoff we were willing to make, but there are better solutions.
OLAP
Analytics databases are the answer. I first experimented with the Timescale extension for Postgres. It's good! But there are some key issues that held me back. Firstly, features like compression aren't bundled as part of the Apache licensed version of the extension, meaning managed providers like Planetscale (who are very good!) can't make use of it. If you do want to go the managed route, you'll end up on one of maybe three main providers. No good for me.
Instead, I've split transactional and analytics workloads out into separate database softwares. Postgres remains for all transactional data, but I've employed ClickHouse for storing metrics. ClickHouse is a beast for this, it sports incredible compression ability and super fast aggregation operations across huge datasets. Perfect for this usecase.
Kafka
As analytics databases like their data to be inserted in chunks rather than one-by-one, I knew that using discrete Laravel queued jobs for storing metrics when received wouldn't cut it. Initially, I used Redis streams to store the data as it came in, then a dedicated ingest worker would grab up to 1000 records and insert them in bulk. There's a 5 second limit on data stagnation, so even if there aren't 1000 ready to train after that 5 second window, we drain what we can.
Redis ended up filling my VPS of data. The worker got delayed and Redis backed up hard. I didn't love that, and I also didn't love working with it to begin with to be honest. I started looking for other solutions.
Kafka is an event streaming platform built for exactly this sort of thing. I did some research and landed on RedPanda, which is a Kafka-compatible platform but is way lighter and faster. I didn't want to spend loads on infrastructure - especially while still in development - so RedPanda was the obvious choice.
Frontend
VueJS handles the frontend, with shadcn-vue and built on top of the Laravel Vue Starter Kit. In time ServerGoggles will gain more of a unique identity, but right now the focus is on getting the backend solid and surfacing the data users want to see cleanly.
Daemon
ServerGoggles collects its data via a daemon that runs on your servers. It's a tiny executable written in Go that collects the data we need and sends it to the ServerGoggles API. It has some other features built in like markers, where you can call servergoggles marker and store context that'll show up on your graphs. Completely optional, but there if you need it.